
Algorithmic Trading Systems — GreaterWaves
Professionally developed algorithmic trading systems deployed live on Darwinex, each with an independent, fully audited track record.
These systems are designed to operate across different market regimes, asset classes, and time horizons — with a strong focus on risk control, statistical edge, and long-term robustness.
Scroll down to explore how each system behaves individually, how they compare to traditional benchmarks, and how they interact with each other.
Live Systems in Production
Below are four proprietary algorithmic trading systems, each designed around a distinct execution logic and market objective.
Instead of relying on a single monolithic strategy, the systems are intentionally diversified across:
- Trading horizon
- Asset class
- Market behavior (trend following, mean reversion, rotation)
All results shown are live, audited, and independently verified by Darwinex.
DARWIN GWS
Alpha táctico multi-estrategia en mercados globales líquidos
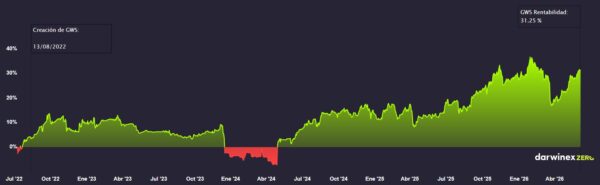
Track record en vivo desde 2022
Drawdown máximo: -23%
Rentabilidad anualizada: 7%
AuM: 60.000 €+
DARWIN GWV
Since June 2026, quantitative short-selling strategies across selected equities
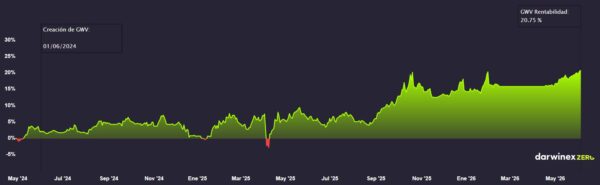
Live track record since 2024
Max Drawdown: -10%
Annualized return: 9%
AuM: €0.0
DARWIN UMH
Alpha ajustado por volatilidad sobre comportamientos de mercado recurrentes
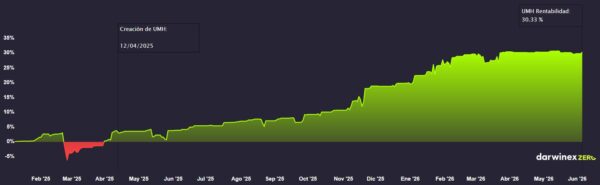
Track record en vivo desde 2025
Drawdown máximo: -9%
Rentabilidad anualizada: 21%
AuM: 70.000 €+
DARWIN PWZT
Asignación sistemática de renta variable basada en señales cross-sectional
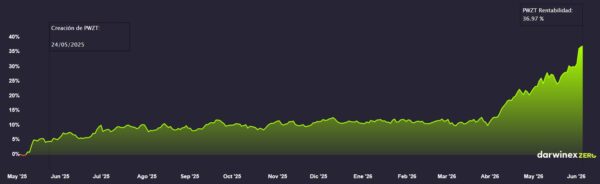
Track record en vivo desde 2025
Drawdown máximo: -4%
Rentabilidad anualizada: 33%
AuM: 300.000 €+
DARWIN VMZW
Trend-following strategies in crypto markets with asymmetric risk
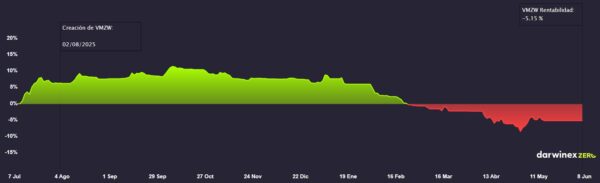
Track record en vivo desde 2025
Max Drawdown: -14%
Annualized return: -6%
AuM: €0.0
DARWIN COFR
S&P500 long-only rule-based strategies that switch to cash to protect capital
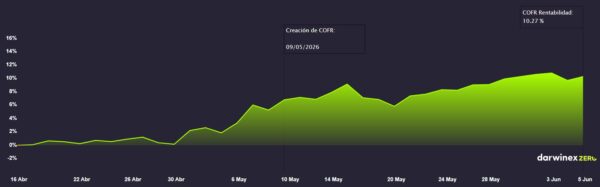
Live track record since March, 2026
Drawdown máximo: -4%
Annualized return: 104%
AuM: €30,000
Data as of June 2026.
These live algorithmic strategies combine multiple sources of alpha and systematic allocation models across equities, indices, forex, commodities, and crypto markets.
2025 Algorithmic Trading Systems vs Global Benchmarks
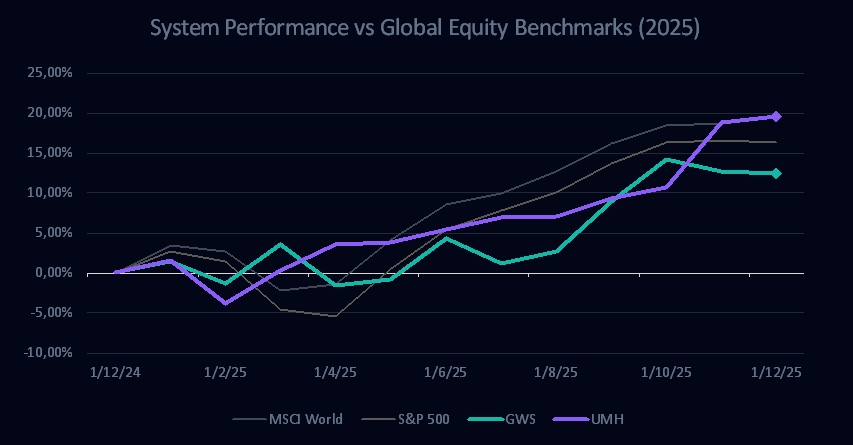
A performance comparison between selected algorithmic trading systems and traditional equity benchmarks during 2025.
Performance
The chart illustrates how each system progressed over time compared to MSCI World and the S&P 500, highlighting differences in growth and volatility.
Drawdown
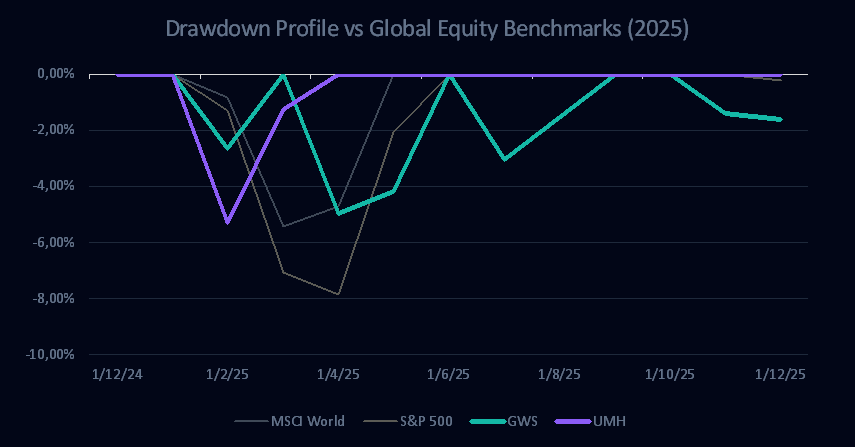
This view focuses on capital preservation, showing how systems declined and recovered during adverse market phases.
Data as of January 2026.
Key Observations
- Shallower drawdowns: GreaterWaves systems experienced smaller and shorter drawdowns compared to traditional equity benchmarks during market pullbacks.
- Faster recoveries: Both systems returned to new highs earlier than equity indices following periods of stress.
- Different return paths: Performance trajectories differ materially from benchmark behavior, reflecting non-equity-driven sources of return.
Relative Behavior of the Systems vs Global Markets
Understanding correlation is critical when combining systems or integrating them alongside traditional portfolios.
The chart below illustrates how the systems relate to each other and to equity benchmarks over the same period.
2025 Cross-Correlation
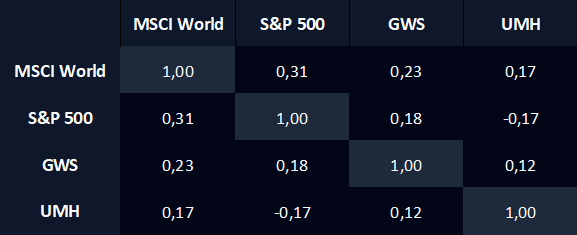
Correlation ranges from −1 (perfect inverse relationship) to +1 (perfect positive relationship).
Key Correlation Insights
- Low equity exposure – Correlation to MSCI World and S&P 500 remains low (≈ 0.07–0.25).
- Internal diversification – GWS and UMH add differentiated behavior within a portfolio (≈ 0.12 r).
Correlations calculated on live, audited returns.
How You Invest in GreaterWaves Trading Systems
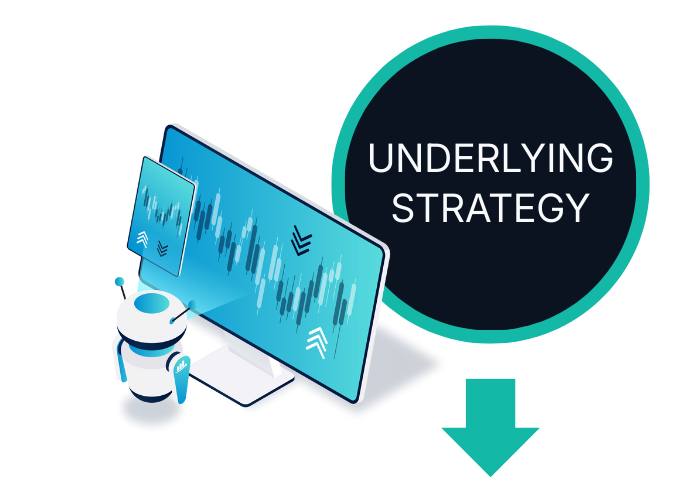
What Are GreaterWaves Portfolios?
My portfolios are proprietary trading systems powered by algorithms that I build, fund and trade with my own capital.
Each combines multiple models—trend-following, break-out and mean-reversion—across Forex, US equity indices, US equities, gold and cryptocurrencies.
All run live 24/7, generating the signals that power every DARWIN I list.
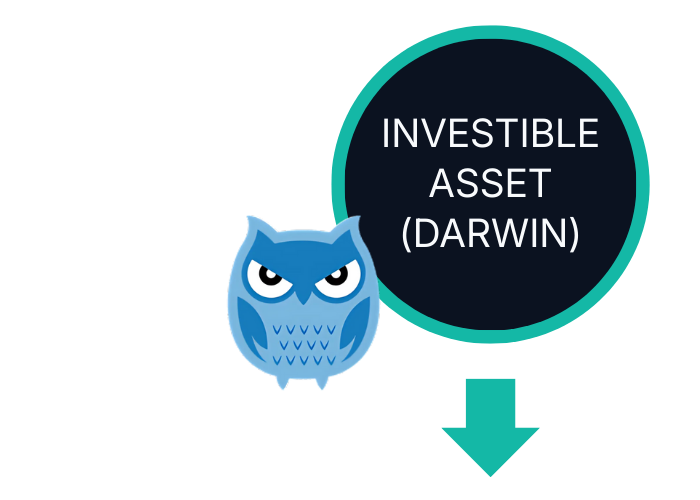
Investible Vehicles For The Portfolios
Each Portfolio is open to investors through a DARWIN, which is a risk-adjusted replica of each system, published on Darwinex (regulated by CNMV & FCA).
Key points
• Target VaR 6.5 % — risk standardised and capped
• Fully audited trade history and real-time metrics
• Same execution price for every investor through Darwinex’s infrastructure.
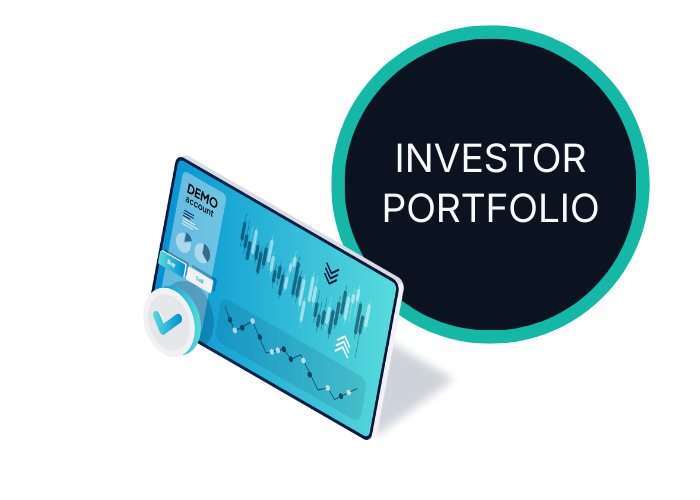
Investor Portfolio
Open a free Darwinex account, search the tickers and assign any weighting you like. Darwinex mirrors the trades automatically and handles risk management.
Your terms
- 1.2 % annual management fee
- 20 % performance fee, charged only on new profits (high-water mark)
- Capital stays in your own segregated account—deposit or withdraw whenever you want.
*Affiliate link: we may earn a small commission — at no extra cost to you.
CFDs are complex instruments and come with a high risk of losing money rapidly due to leverage. 56% of retail investor accounts lose money when trading CFDs with this provider. You should consider whether you understand how CFDs work and whether you can afford to take the high risk of losing your money.